Data Analytics & BI, coursework, 2026
Bike Sharing Demand Dashboard
EDA and an interactive Streamlit dashboard showing how weather and time drive bike-rental demand in Washington, D.C.
Streamlit apps sleep when idle and can take up to a minute to wake.
The problem
Bike-sharing operators need to understand when and why demand peaks to plan fleet availability.
What it does
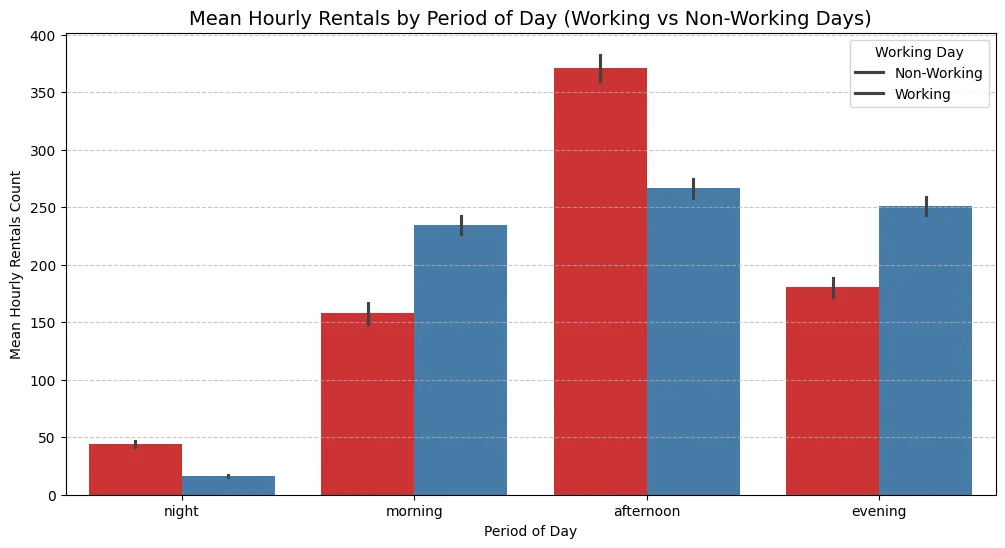
- Feature engineering: year, month, hour and a day-period variable.
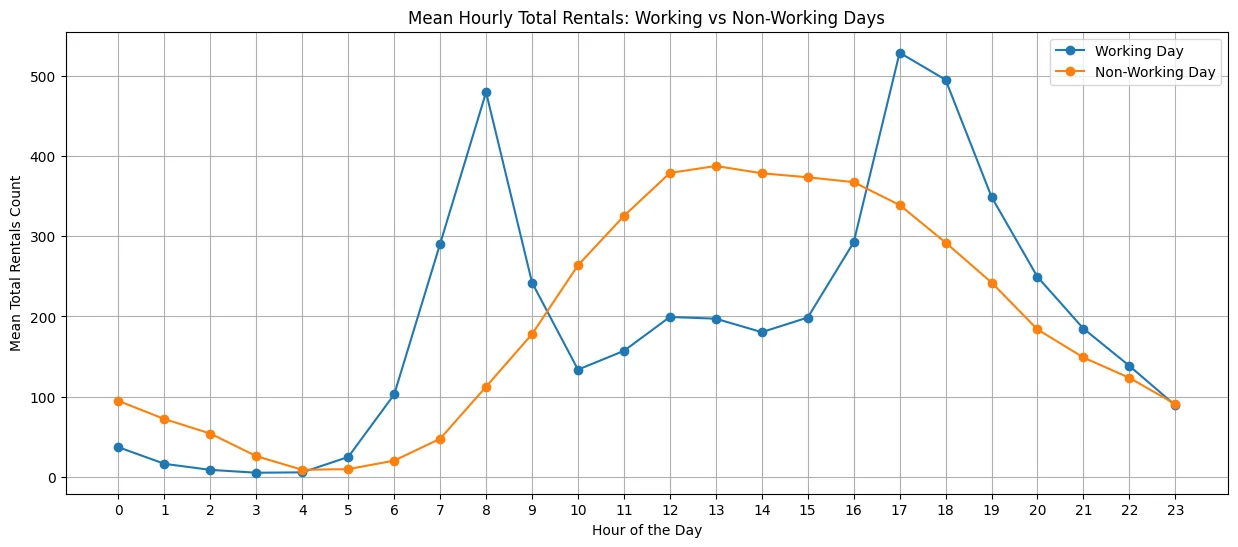
- Casual vs. registered, working vs. non-working days and seasonal trends.
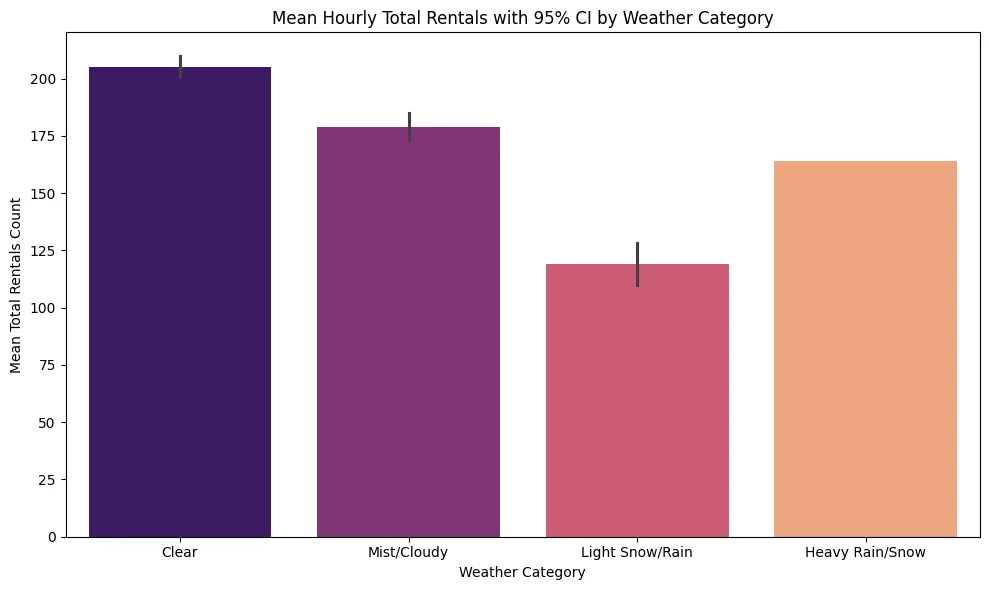
- Hourly demand with 95% confidence intervals by weather condition.
- Dashboard filters for date, season, weather, hour and temperature with KPI tiles.
Built with
- Python
- Pandas
- Matplotlib
- Seaborn
- Streamlit
From the repository
Screenshots and charts as they appear in the project's code and notebooks.