Data Analytics & BI, 2026
Bank Loan Analysis 2021
Loan-portfolio analysis with an interactive Streamlit dashboard covering applications, funding, repayments and loan health.
Streamlit apps sleep when idle and can take up to a minute to wake.
The problem
Lenders need a clear view of application trends, funded vs. received amounts and loan status to monitor portfolio risk.
What it does
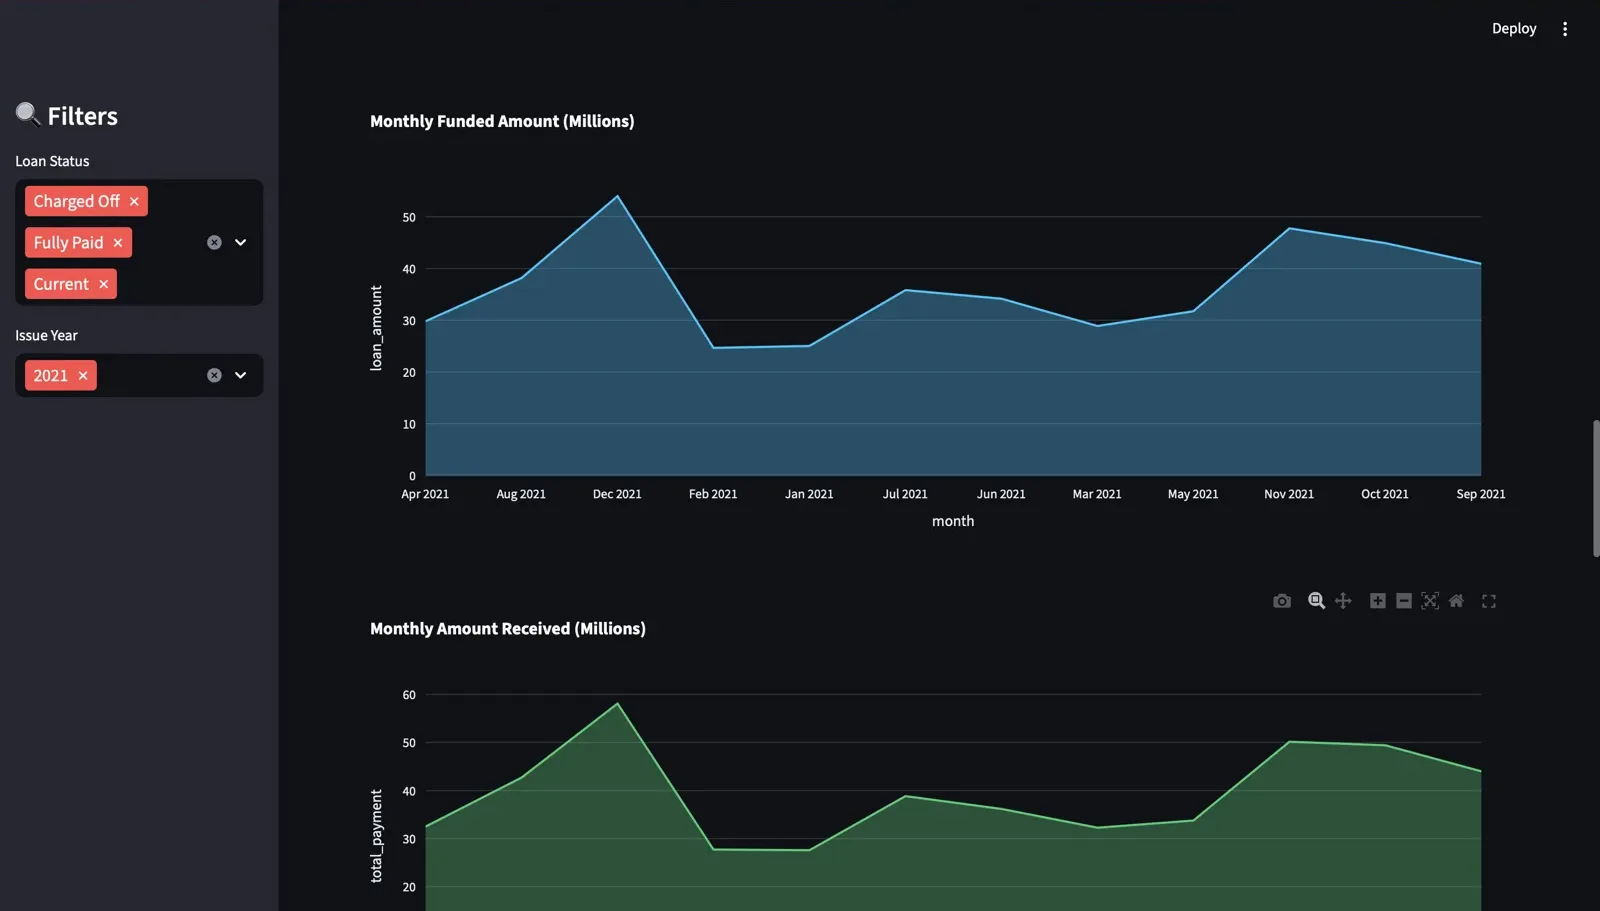
- Datetime feature engineering for monthly and yearly trend analysis.
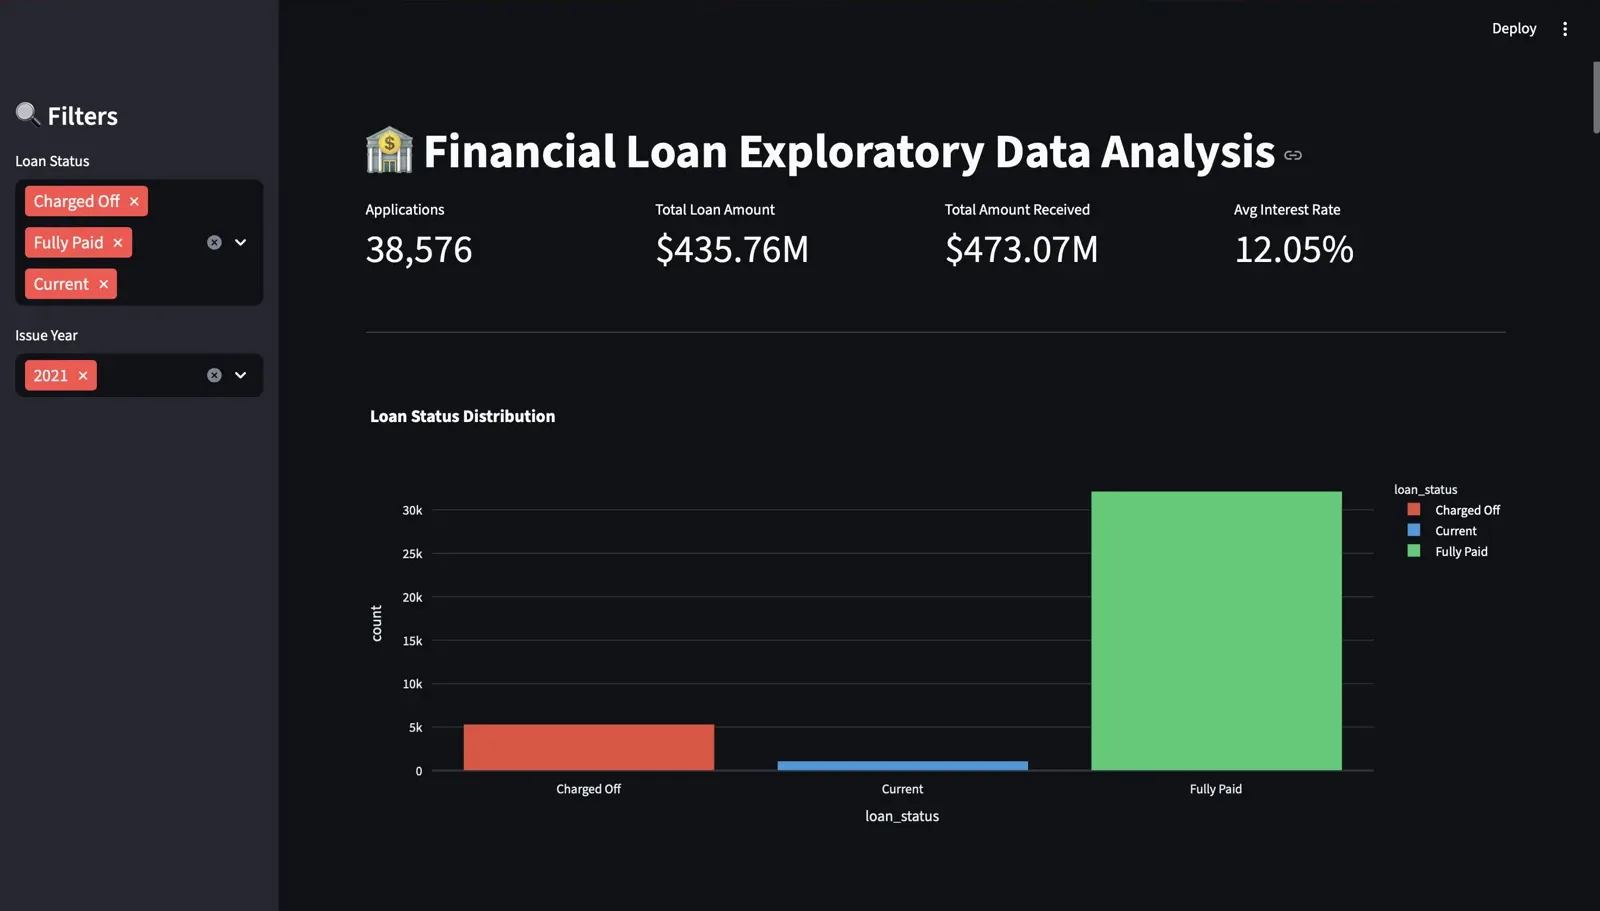
- KPIs: total applications, funded and received amounts, average interest rate and DTI.
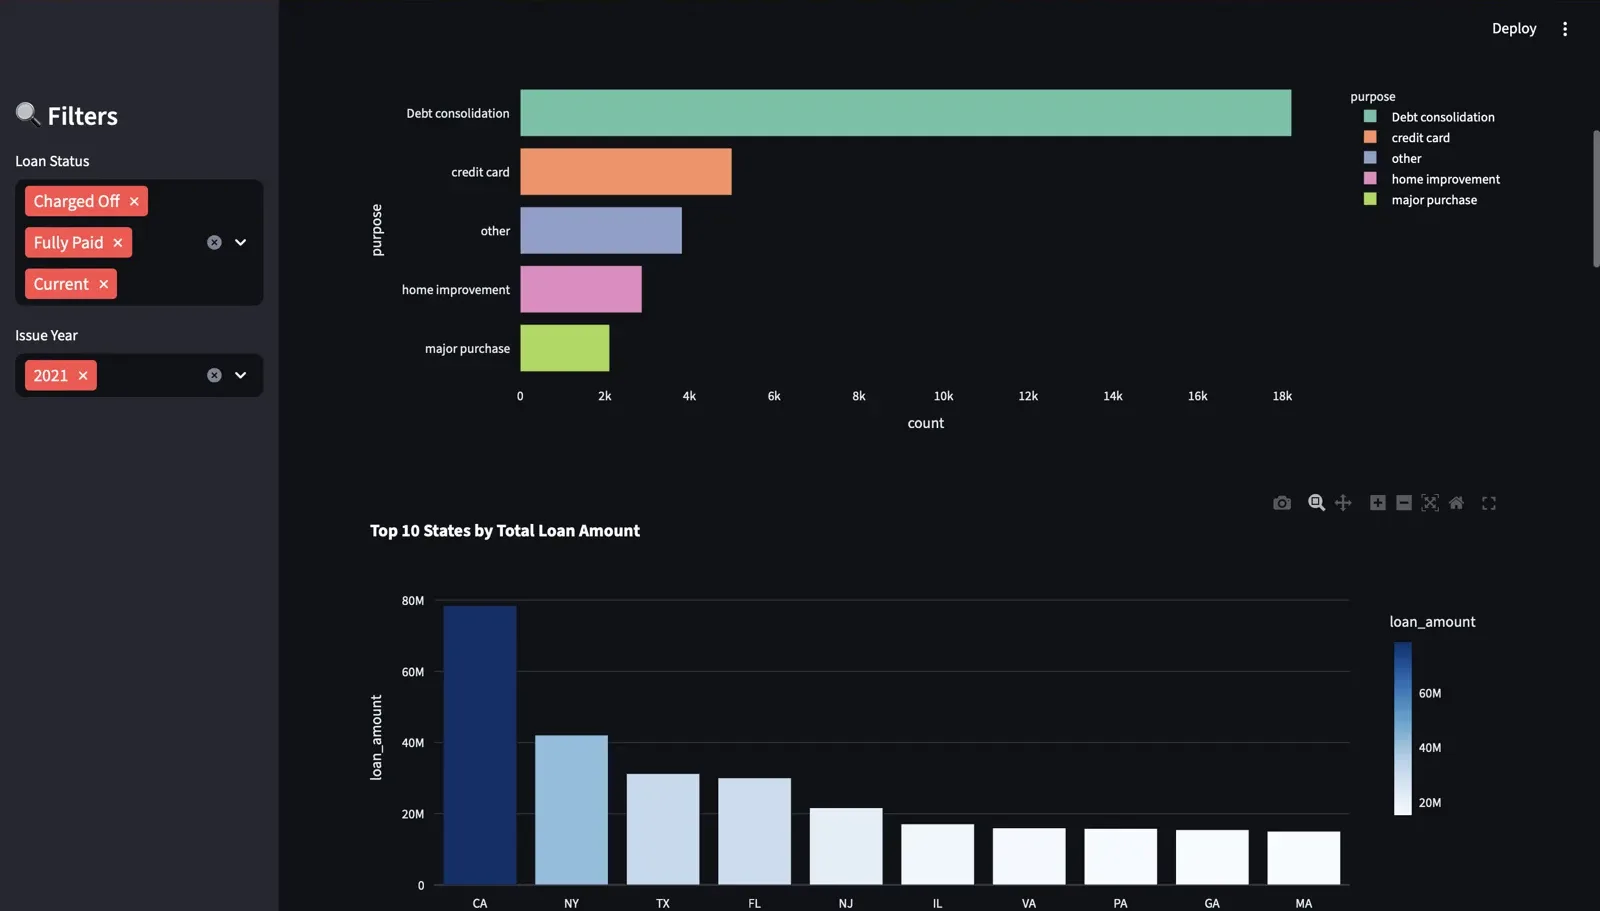
- Breakdowns by loan status, purpose, home ownership and employment length.
- Streamlit dashboard with trend and status views.
Built with
- Python
- Pandas
- NumPy
- Matplotlib
- Seaborn
- Streamlit
From the repository
Screenshots and charts as they appear in the project's code and notebooks.